The data presented on this page are provided to support the following open access article:
Crua, C, Manin, J and Pickett, LM. On the transcritical mixing of fuels at diesel engine conditions. Fuel (2017), DOI:10.1016/j.fuel.2017.06.091
This dataset is archived at DOI:10/58P, and available under a CC BY-NC-ND 4.0 license.
For more information contact Prof. Cyril Crua or email researchdata@brighton.ac.uk
Videos files
Figure 5 - Supplementary Video 1: Defocus during vessel preburn
Supplementary Video 1: Ronchi ruling tilted by 56.4° along the optical axis to characterise defocus before preburn, during preburn, and at the start of injection trigger at ECN Spray A conditions (22.8 kg m-3, 904 K). Crosses indicate the best local focus position, and the red line the estimated defocus across the whole frame. Before preburn (t ≤ -2000 ms) the focus is just above mid-frame. During preburn (-2000 ms ≤ t ≤ 0 ms) the convective currents inside the vessel introduce significant optical distortions, resulting in randomly focused and defocused regions. At the start of injection trigger (t = 0 ms) the focus has somewhat stabilised but shifted away from the microscope.
Download video file: MP4 (125 MB)
Figure 7a - Video 1: Classical atomisation and evaporation
Video 1: Injections of n-hexadecane into gas at 38 kg m-3 and 907 K (7.9 MPa), corresponding to Tr = 1.3 and Pr = 5.6. After atomization all droplets converge to spherical shapes, with their diameters progressively reducing. This behaviour is characteristic of a classical evaporation process, even though the conditions are above the critical point of n-hexadecane.
Download raw unprocessed video file: AVI (430 MB), metadata
Figure 7b - Video 2: Diffusive mixing
Video 2: Injections of n-hexadecane into gas at 38 kg m-3 and 1228 K (10.7 MPa), corresponding to Tr = 1.7 and Pr = 7.6. After atomization most droplets oscillate, remaining non-spherical, and abruptly transitioning to vapour phase. At the point of transition the droplets' shape follow a pattern that could be described as a backward-facing bag.
Download raw unprocessed video file: AVI (430 MB), metadata
Figure 8 - Video 3: Effect of operating conditions
Video 3: Evolution of individual n-dodecane droplets into gas at 30.4 kg m-3, as a function of ambient pressure and temperature. Each image represents a 300 μm × 300 μm field of view centred on the moving droplet.
- 700 K, 6.2 MPa gas (Tr = 1.1, Pr = 4.4): The droplet remains spherical with a continuous reduction in diameter, indicating a classical evaporation process.
- 1000 K, 8.8 MPa gas (Tr = 1.5, Pr = 6.3): Deformations occur before disintegration is initiated at the wake side of the droplet.
- 1200 K, 10.6 MPa gas (Tr = 1.8, Pr = 7.6): Significant deformations occur before the fuel appears to stretch and diffuse, readily mixing with the surrounding gas without evidence of surface tension.
Download video file: MP4 (3 MB)
Figure 10 - Video 4: Effect of fuel properties
Video 4: Evolution of individual droplets into gas at 30.4 kg m-3 (1200 K, ≈ 10.6 MPa) as a function of fuel type. Each image represents a 300 μm × 300 μm field of view centred on the moving droplet.
- The n-heptane droplet follows a diffusive mixing process from the nozzle's exit throughout the video sequence.
- The n-dodecane droplet deforms until stretching and diffusing with the surrounding gas with no further evidence of surface tension.
- The n-hexadecane droplet experiences significant oscillations before transitioning into a dense fluid from the wake side.
Download video file: MP4 (2 MB)
Figure 11 - Video 5: Fully diffusive mixing
Video 5: The end of injection for n-heptane at 30.4 kg m-3, 1198 K (10.4 MPa). At these extreme conditions surface tension appears inexistent and a traditional atomization process cannot be observed. Diffusive mixing seems to take place from the nozzle outlet, indicating a supercritical injection process.
Download raw unprocessed video file: AVI, metadata
Figures
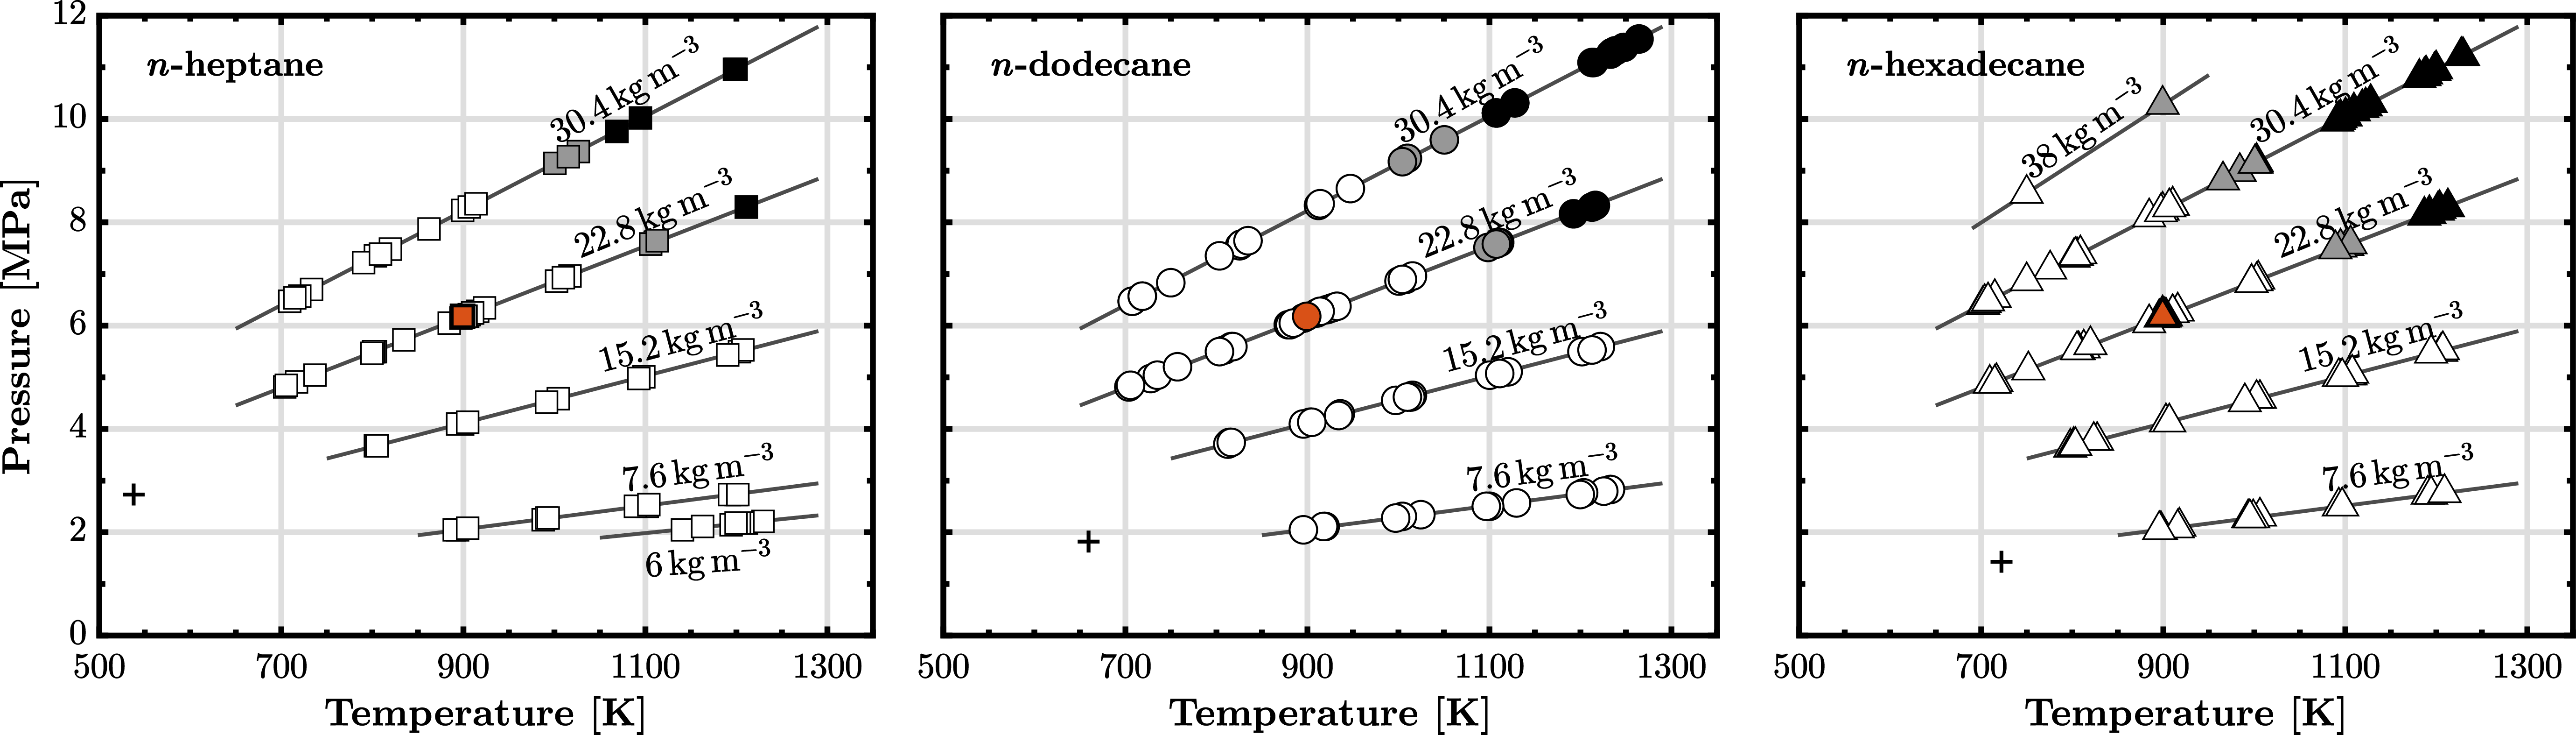
Figure 12: Gas pressure–temperature diagrams
Figure 12: Gas pressure-temperature diagrams showing our classification of mixing regimes for each fuel. Red symbols indicate the ECN Spray A test condition (22.8 kg m-3, 900 K). White symbols represent a classical evaporation regime where droplets remain spherical and exhibit a progressive mass transfer. Grey symbols indicate a transitional mixing regime where droplets show evidence of a reduced surface tension, with significant stretching and deformation of the liquid/gas interface leading to an accelerated mixing. Black symbols identify a diffusive mixing regime where atomization and surface tension may be observed initially but fuel parcels rapidly transition into chunks of supercritical fluids with a mixing regime dominated by diffusion and convection, and an evident disappearance of surface tension.
Download figure: PNG, EPS, CSV
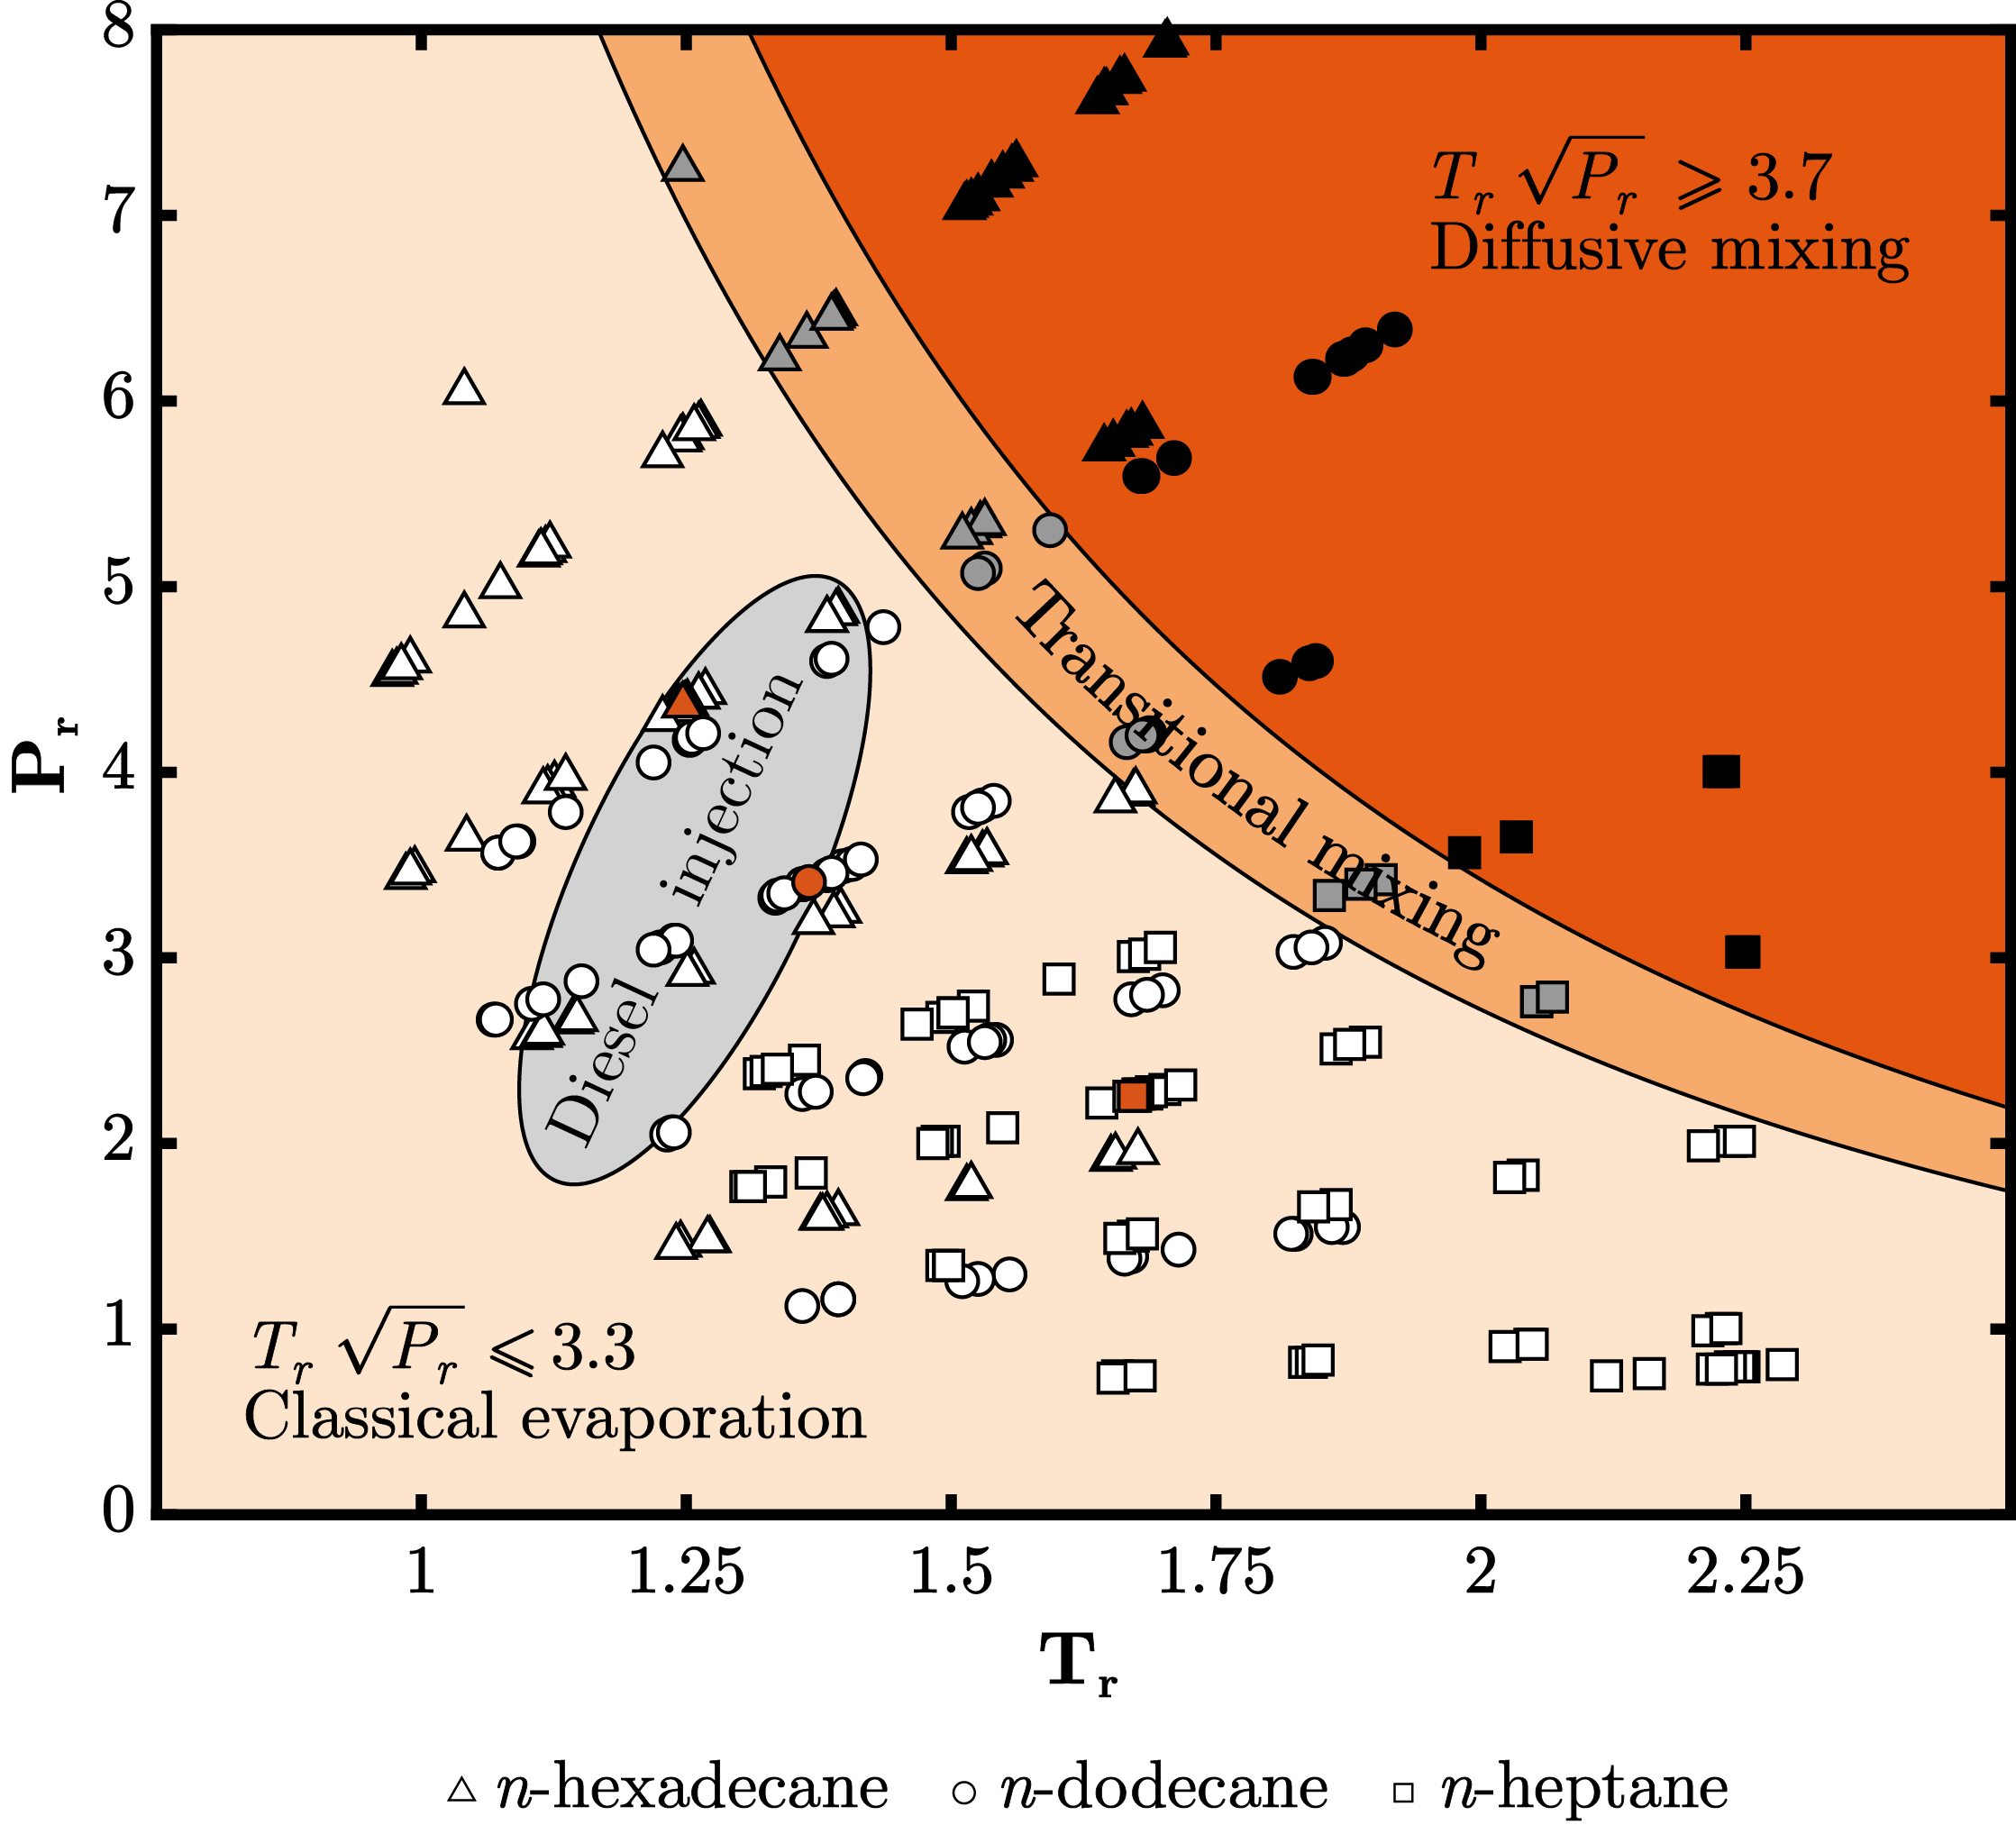
Figure 13: Classification of the mixing regimes
Figure 13: Classification of the mixing regimes for all the experimental conditions. Both Pr and Tr are calculated by dividing the imposed far-field (Pg,Tg) values by the critical values of the fuel (Pc,Tc). White symbols represent test conditions where classical evaporation is observed, with droplets remaining spherical throughout their lifetime. Grey symbols indicate conditions where droplets undergo a transitional mixing with evidence of surface tension but significant droplet stretching and deformation, leading to an accelerated mixing. Black symbols indicate conditions where surface tension may be observed initially but the droplets rapidly transition to a mixing regime dominated by diffusion, with no more evidence of surface tension. The red symbols indicate the standard ECN Spray A test conditions (22.8 kg m-3, 900 K, ≈ 6 MPa) for each alkane. The area highlighted in grey illustrates an envelope of conditions relevant to the injection of a multi-component fuel into a modern diesel engine (Pg ≈ 4 – 11 MPa, Tg ≈ 800 – 1000 K, Pc = 2.2 MPa, Tc = 720 K).
Download figure: PNG, EPS, CSV
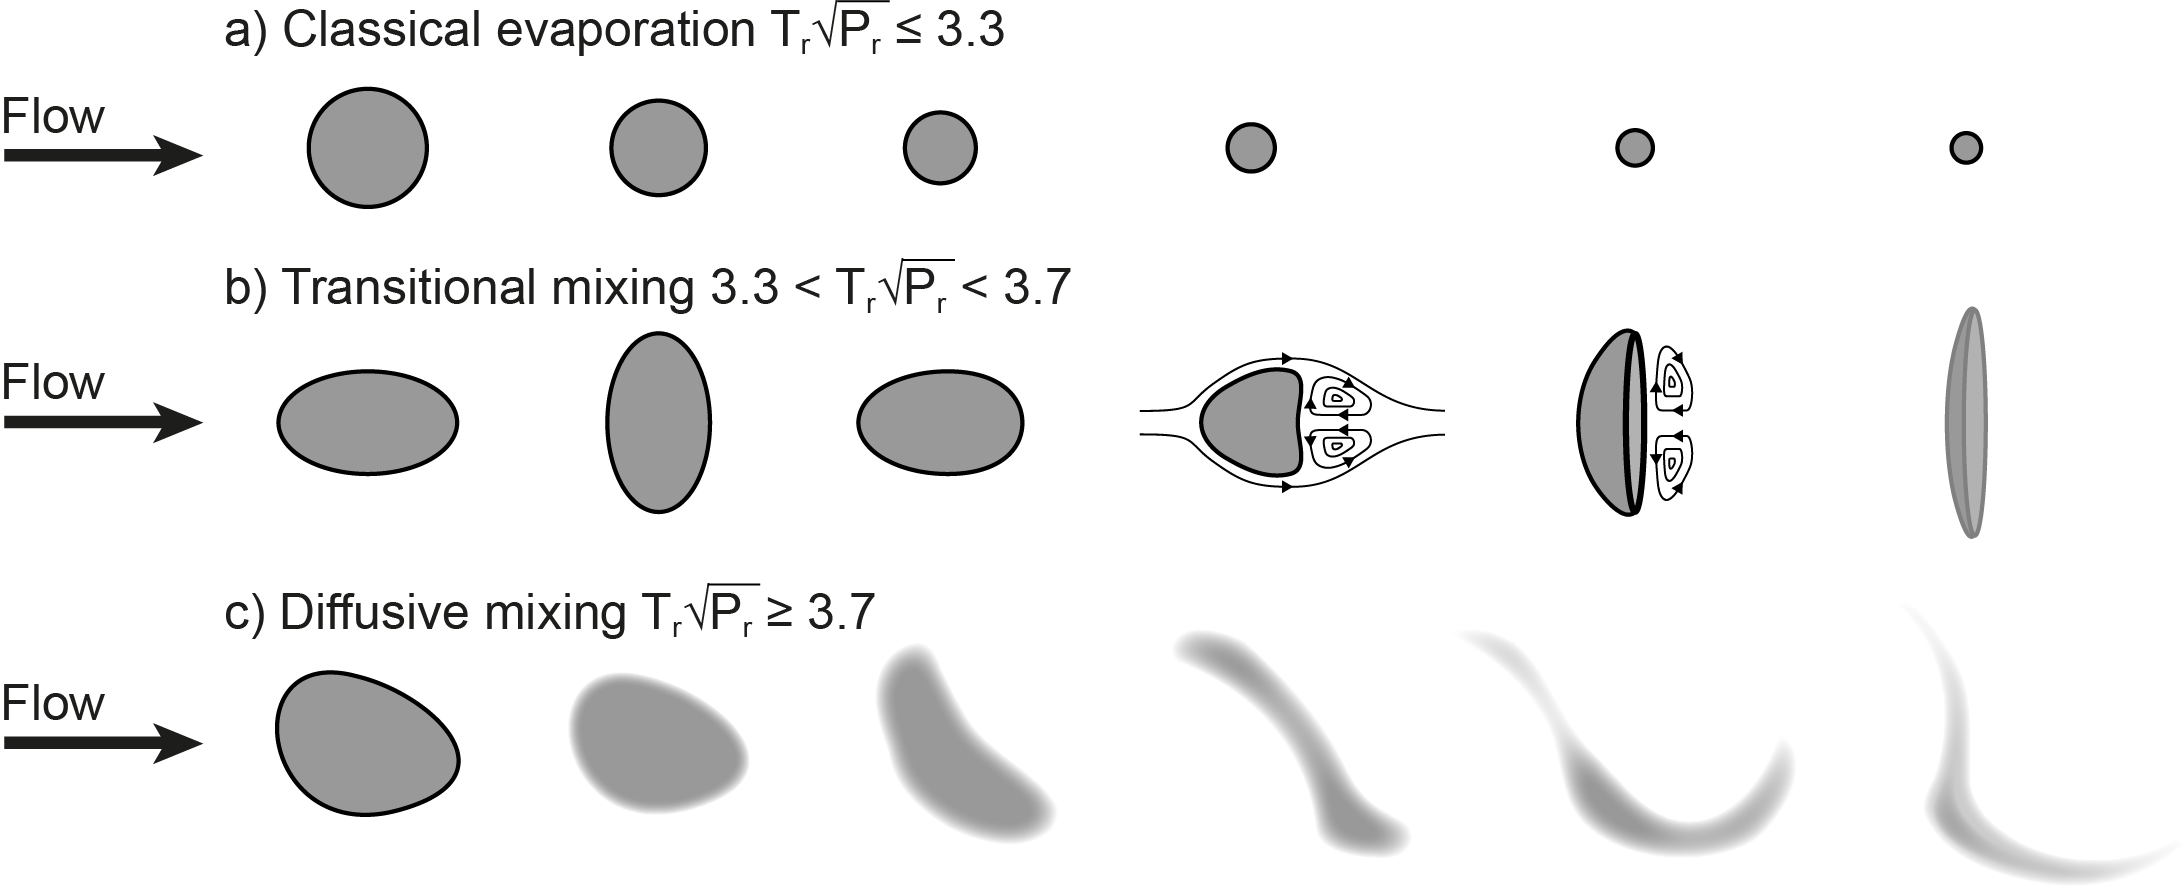
Figure 14: Conceptual model of droplet mixing regimes
Figure 14: Conceptual model of droplet mixing regimes. Classical evaporation is a significant feature of fuel spray mixing, even at ambient gas conditions nominally above the fuel's critical point. Transitional mixing is characterised by a rapidly diminished surface tension. Droplet disintegration is initiated at the wake side, resembling a backward-facing bag due to the formation of a recirculating eddy. Diffusive mixing in transcritical regime may initially include a liquid/gas interface, although droplets cannot be assumed spherical as they deform continuously. The fuel rapidly transitions to a single-phase mixing regime dominated by interdiffusion and convection, with no evidence of elastic interfaces. The optically-dense chunks of supercritical fluid diffuse with the surrounding gas and mix through small-scale turbulence.
Datasets
Download data for Figures 12 and 13: Fig12_13.csv
Repository links
Published article: http://dx.doi.org/10.1016/j.fuel.2017.06.091
This dataset: http://doi.org/58P
Licence

This work is licensed under a Creative Commons Attribution-NonCommercial-NoDerivatives 4.0 International License.